Climbing Ripples I.

Ripples, dunes, cross bedding and cross lamination have always been some of the sexiest subjects in sedimentary geology. They are certainly responsible (in part) for my choice of a certain walk of life that consists of studying dirt. You might say that everything has been already said about ripples and dunes, and you clearly get that feeling if you read some of J.R.L. Allen’s work on the subject (and that can be a lot of reading, by the way) or look at the fantastic multimedia material that David Rubin at the USGS put together. [Of course, there are numerous other authors who have written great papers on the subject, but it is not my purpose here to write a history of bedform sedimentology. Although that would be an interesting subject, if somebody had the time for it.]

However, little of this material gets into the standard sedimentology and stratigraphy textbooks. Maybe rightly so: after all, textbooks are not supposed to include all the details about any particular subject. And maybe there are higher-density issues out there, like whether we should call something a turbidite or a debrite. [Sorry, I could not refrain from typing that].

Take for example climbing ripples. They form when several trains of ripples are superimposed on each other and they seem to ‘climb’, by generating stratigraphic surfaces that are tilted in an upcurrent direction. [Note however that these surfaces are *not* topographic – or time – surfaces; more on that later]. Numerous textbooks and many papers mention climbing ripple cross lamination, but often the explanation is something like “they indicate high rates of deposition”, or “the steepness of the climb and stoss-side preservation are a function of the ratio between suspended-load and bedload”. The question is, what do we *exactly* mean by ‘high rates of deposition’? If we cannot put numbers on it, it is not that informative. Also, by ‘suspended load’, do we mean suspended load concentration? Or deposition from suspended load and bedload, respectively? Those statements are not necessarily wrong, but they do not do justice to the models that have been published many years ago, models that actually have some numbers and equations behind the “conclusion” section.

The key paper that I am talking about is “A quantitative model of climbing ripples and their cross-laminated deposit“, by J.R.L. Allen, published in 1970 in the journal Sedimentology.

The most important relationship that Allen has derived links the angle of climb ζ (see the sketch below) to the rate of deposition M (measured in units of mass over unit time and area), the rate of bedload sediment transport j, and the ripple height H:

tanζ = MH / 2j

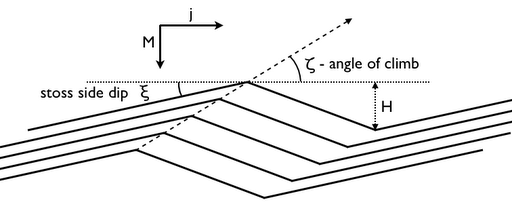
This is simply based on decomposing the sediment flux to and through the bed into vertical and horizontal components (plus a relationship between the horizontal sediment transport rate in ripples and the horizontal migration rate of the bedforms). Note that the quantity j refers to the sediment mass that moves through a cross section perpendicular to the general current direction, and does this by being part of the ripples themselves. In other words, there is no direct equivalence between M and suspended load deposition, and j and bedload deposition. Although it is possible that in general suspended load contributes more to M than deposition from bedload, it says nowhere that grains transported within the bedload cannot be deposited on the stoss side of the ripples and thus contribute to the vertical growth of the bed.

Obviously, if the angle of climb is smaller than the dip of the stoss side, there will be no stoss side preservation and the resulting cross lamination will look like in the sketch below (which, by the way, was quite an effort to generate in Matlab; you can easily do this and much-much more with David Rubin’s Matlab code, but I wanted to understand things a little better by coding something simple myself):

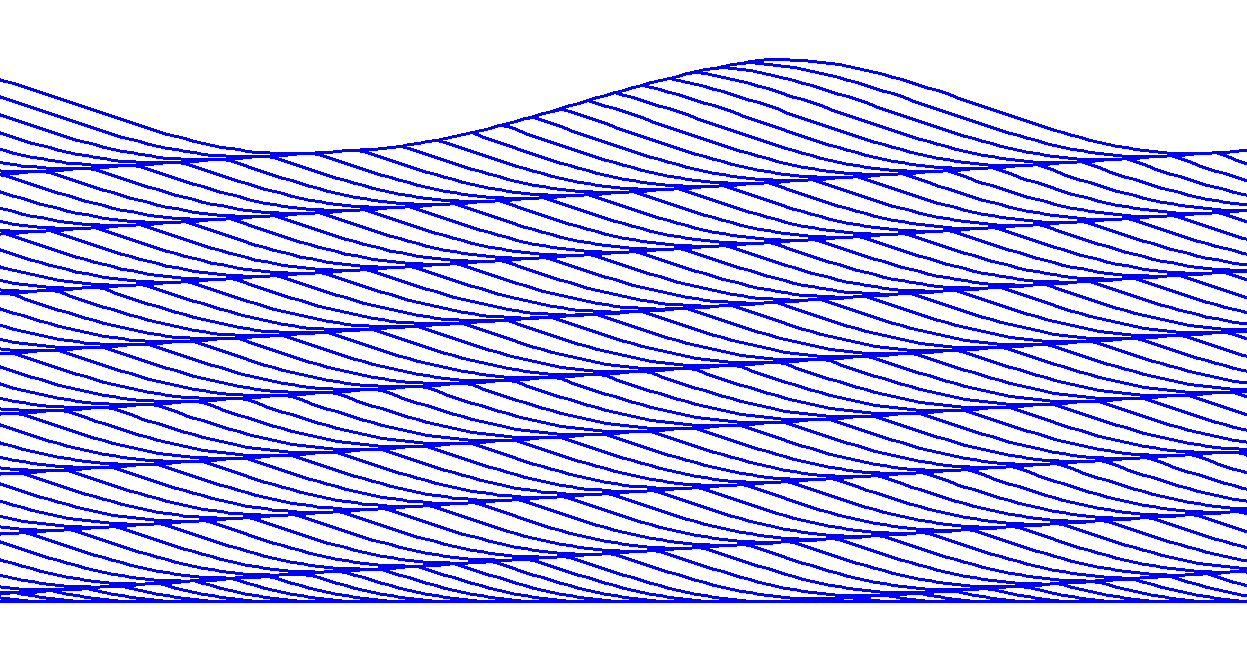
This is often called ‘A-type’ (or subcritical) climbing ripple cross lamination, but everybody knows what you are talking about if you “simply” call it climbing ripple cross lamination with no stoss-side preservation.

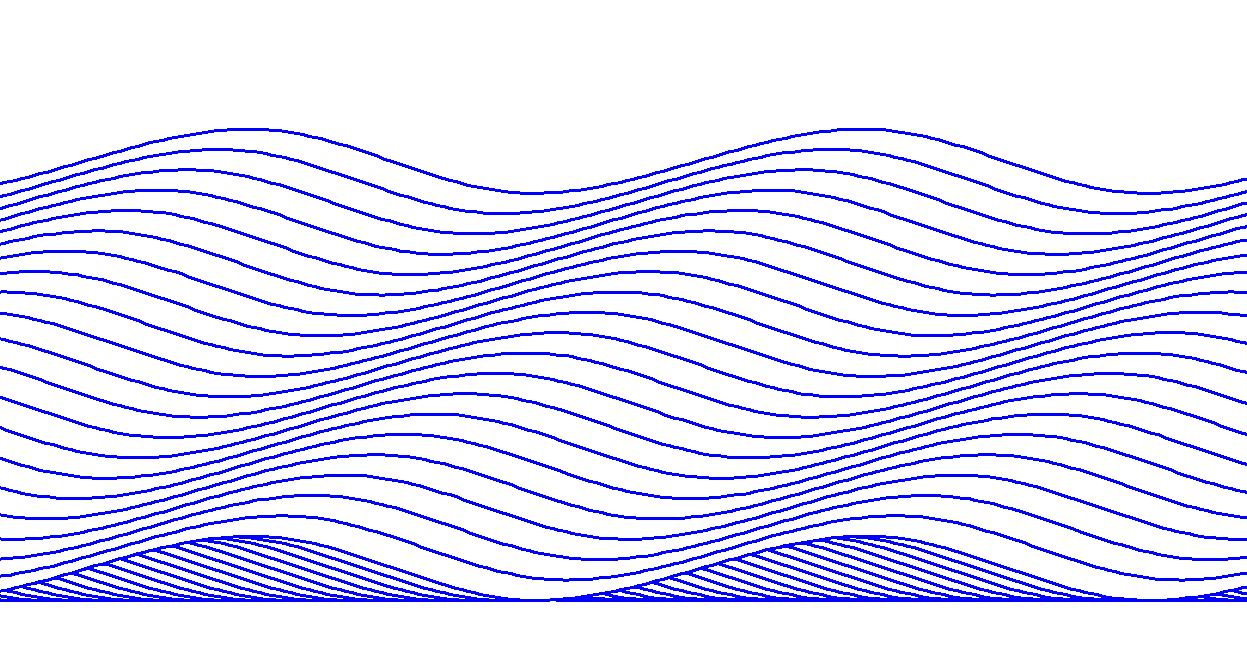
In contrast, aggradation is much more prominent if the angle of climb is larger than the slope of the stoss side, and in this case deposition takes place on the stoss sides as well, resulting in ‘S-type’ (or supercritical) lamination:

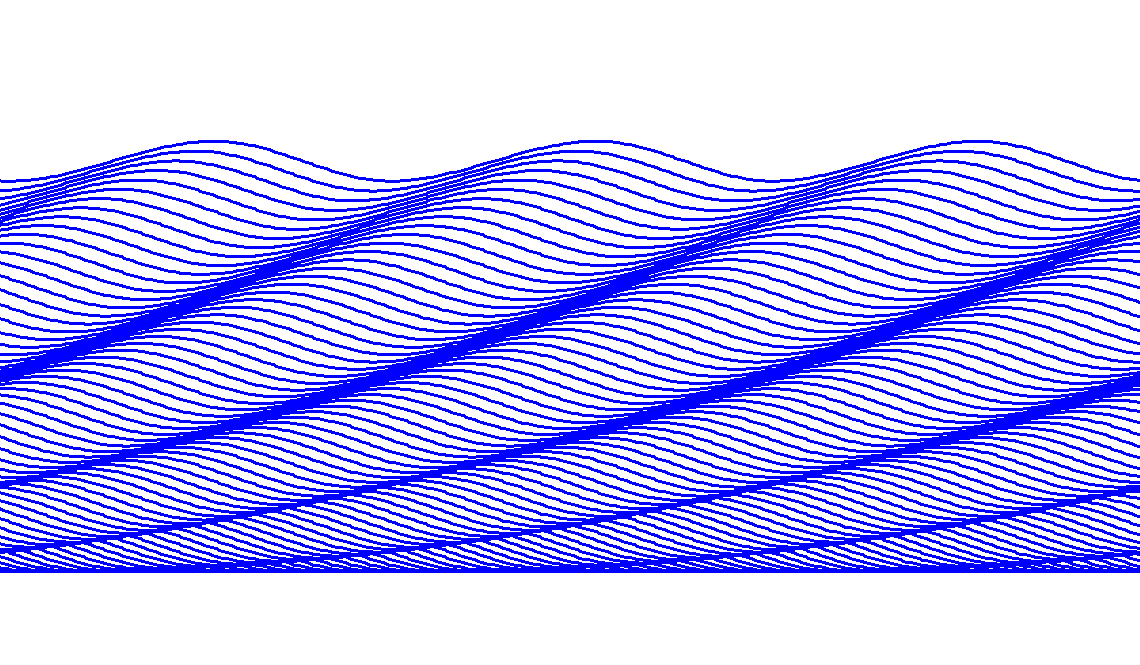
Of course, it says nowhere that the rate of deposition M or the bedload transport rate j must stay constant through time. If the ratio of these quantities changes, the angle of climb will change as well. This sketch shows an example where the rate of deposition M increases through time:

One of the main points of the paper is that there is a fundamental difference between the rate of deposition M and the bedload sediment transport rate j. A rate of deposition larger than zero means that the sediment transport rate within the flow must decrease from an upcurrent position to a downcurrent position; a simple mass balance tells us that this change in the sediment transport rate has to equal the rate of deposition. In other words, the rate of deposition M is a derivative of the sediment transport rate, and as such, does not belong in the same drawer of physical quantities as the bedload transport rate.

Along the same line of thought, Allen emphasizes that climbing ripple lamination says something about flow uniformity and steadiness. A uniform and steady flow can only form a single train of ripples; either non-uniformity or unsteadiness is needed to have climbing-ripple deposition.

That’s it for now; to be continued. It’s time to do my taxes.

Further reading: Brian has a Friday Field Photo and a Geopuzzle on climbing ripples. Here are some pictures and a movie of climbing ripples generated by a turbidity current in a flume.

(Petroleum) geology in the movies: There Will Be Blood

[This is a contribution to Accretionary Wedge #7.]

One of the most memorable movies I have ever seen happens to be about a geologist who strikes it rich with oil in Southern California of the early 1900s. It is also probably the only movie with quite a bit of geology in that has won two Oscars (but I am not really a movie junkie so corrections are welcome).

Of course, I am talking about There Will Be Blood, director Paul Thomas Anderson’s epic story about greed, religion, vengeance, murder, and other delightful human endeavors, written, shot, and acted so well that it is an instant classic, a piece of work comparable to the greatest Greek tragedies. Daniel Day-Lewis took home a second Oscar for his work, and there is a good reason for that: his performance is so powerful that in my mind the only other film character of comparable strength and weight and effect is John Proctor in “The Crucible“, …which also happens to be played by Daniel Day-Lewis.


Despite (and because of) its greatness, this movie is not for the faint-hearted. It is very unlike the average Hollywood production, and, if you want to leave the theater with that sweet reassurance of knowing exactly what is good and what is bad, well, then skip this one. Despite the almost unequivocal depiction by critics of the Daniel Day-Lewis character as a monster – and, I admit, Daniel Plainview is not exactly a charming person -, let’s recognize that many of his thoughts and emotions are not foreign to most individuals that belong to the ‘Homo sapiens’ species. To me, the most scary and most monstrous character of the movie is Eli Sunday, the equally greedy but extremely irrational and hypocritical church leader and faith healer, played very convincingly by Paul Dano.

In any case, it is worth suffering through the two-and-a-half hours, if for nothing else but the realistic depiction of the oil industry at the beginning of the twentieth century. The movie does very well in terms of ‘geological correctness’; certainly much better than most disaster movies with Bruce Willis in the driving seat saving the World from the evil forces of Nature. The only minor issue I can think of is whether it is possible to find oil in a silver mine (Daniel Plainview is a silver prospector before he turns into an oil man). It’s been a long time since I read anything about ore deposits, but silver likes to accumulate in somewhat hotter different places than oil (unless it is in placer deposits).


Still, the best geological ‘delicacy’ in the movie comes at the very end. I would have never thought that you can make petroleum geology (or reservoir engineering) the centerpiece of a shocking movie scene, replete with human tragedy and profound proclamations about delicate philosophical issues.

Further reading: an excellent little piece about the geological aspects of the movie here.

And finally, here is a passage that gives an idea of how some people think about geologists (source):

“The fact is, Plainview is barely human to begin with, so watching him grow coarser and uglier and more full of himself seems a theme more suited to a geologist than a storyteller.”

Ouch.

Some questions about the ‘megatsunami-chevrons’

The allegedly tsunami-related chevron-shaped nearshore deposits are back in the center of attention, at least among geo-bloggers. And rightly so: the idea that lots of coastal sand sheets all over the world were generated by relatively recent, impact-related mega-tsunamis of unimaginable scale is a fascinating hypothesis and, if proven true, it would revolutionize not only our understanding of frequency of meteorite impacts, but also change the predominant views about coastal geomorphology.

However, I have to confess that I find the geomorphologic and sedimentologic side of the argument fairly weakly constructed and documented, at least in the papers I was able to google up. Here are a few questions that could be asked to clarify some issues.

Many of the aerial photographs of the so-called chevrons could be used as textbook examples of parabolic dunes. Parabolic dunes are U-shaped wind-blown dunes usually fed by coastal sand deposits. Their nose points in a downwind direction, that is, the opposite way from barchan dunes. While wind strengths, direction, and sediment source are the main players in the generation of barchan dunes, vegetation plays a key role in the development of parabolic dunes. The ‘arms’ of a parabolic dune are left behind because they have a lower migration rate than the main body and the nose. The lower migration rate is due to plant growth in areas of lower sedimentation and/or erosion. There is a strong correlation between vegetation cover and dune migration rate or activity. This image comes from a recent paper by Duran et al.,


and it shows active (on the left) and inactive (on the right) parabolic dunes. Here is a sketch (source):


So the question is: if ‘chevrons’ are indeed different from classic eolian parabolic dunes, what is this difference, both geomorphologically and sedimentologically? Are they internally stratified? Do they show large-scale cross-bedding? What are the typical grain size distributions? Are they different from typical wind-blown sand? (One of the arguments is that large boulder fields occur in several places; however, my impression is that the boulders described here do not occur within, below, above, or right next to any chevron deposits. This short report claims that large pieces of rock are all over the place in the Madagascar chevrons, but no actual data is presented). The Madagascar chevrons featured in the New York Times show the signatures of typical parabolic dunes: U-shape, vegetated back sides and sandy crest plus nose. Why would an old tsunami deposit be vegetated only in certain places? The simple fact that these dunes are not entirely covered by vegetation suggests that their sandy parts do consist of wind-blown sand. Of course, tsunami deposits can be reworked by the wind, but why would the tsunami-related morphology be so well in tune with the eolian signature?

Second, if the chevrons are indeed produced by tsunamis, the tsunamis must have been humongous. Dune heights are related to flow depth, and a rule of thumb is that flow depth has to be around 6 times the dune height. So a 50 m high dune would require a 300 m high wave. Is that really possible? How big an impact do you need to generate such humongous waves? Also, what about the backwash? Why are most of the chevron dunes pointing systematically in one direction, and do not seem to be altered by any seaward oriented flow?

Third, are any features of the chevrons consistent with what we know about well-documented recent and ancient tsunami deposits? Tsunami-related sandy layers tend to be comparable to turbidites: largely unstratified, normally graded units suggesting rapid deposition from flows of decreasing velocity; they do not show large-scale cross bedding that requires relatively steady flow over longer time scales. In contrast, the chevron morphologies suggest that they are internally well-stratified, as the result of stoss-side avalanches. Here is a sand layer from the 1998 Papua New Guinea tsunami (source):

Obviously, it may turn out that there are tsunami-related coastal dunes and wind-blown parabolic dunes, with very similar morphologies, but fundamentally different origins. At the moment, the geomorphologic and sedimentologic evidence for this extraordinary hypothesis seems quite preliminary. And, needless to say, extraordinary claims require extraordinary evidence.

ps. 1: Lots of information on tsunami deposits here.
And a paper arguing for wind-blown origin of some deposits from the Bahamas, previously interpreted as tsunami-related: Kindler, P. & Strasser, A. (2000) Palaeoclimatic significance of co-occurring wind- and water-induced sedimentary structures in the last-interglacial coastal deposits from Bermuda and the Bahamas. Sedimentary Geology 131, 1-7.

ps. 2: More good stuff on megatsunamis and their deposits at Highly Allochthonous.

Dish structures

Dish structures are sedimentary structures found in thick sand (or sandstone) that have concave-up, bowl-like shapes. They form when water is trying to escape from rapidly deposited sand but encounters horizontal barriers of somewhat lower permeability (usually zones with smaller grain size and/or dispersed mud). These force the water to flow laterally until it finds a place where it can go upward again. In the meantime, the subtle permeability differences get enhanced as muddy particles are washed away from the cleaner parts of the sand and concentrated in zones of lower permeability. The sides of these lower perm zones bend upward as the water finds its way up. Eventually pillar structures, vertical zones of cleaner sands can form on the sides of the dishes.

Initially dish structures were thought to be related to the (still somewhat fuzzy) mechanics of sediment transport and deposition in high-concentration gravity flows. However, clear examples that showed primary sedimentary structures (like cross lamination) being cross cut by dish structures proved that the latter are secondary structures, formed soon after deposition.

Probably because rapid deposition of sand is a requirement for the formation of dishes, these sedimentary structures are largely restricted to deep-water sands. Here are some examples that I think are blogworthy:

This one is from the northern California coast. Note the pillar structures between the dishes. [Apologies for the lack of scale – I think this bed is about 4 feet thick].

This is a zoom-in of dish structures in the Cerro Toro Formation of Southern Chile. Lighter-colored areas probably contain less mud than the darker zones.

No scale on this one either (there was no way I could climb up there), but trust me, these are probably among the largest dish structures in the known universe. They were photographed in northern Peru, near the town of Talara.

And to prove that they are really big, here is a photo that gives an idea of their scale:

Geologic misconceptions: 2D vs. 3D

[This is a contribution to Accretionary Wedge #5]

One of the problems that a geologist is often faced with is the difficulty of reconstructing a complex three-dimensional geometry and history from limited information that is often one-dimensional (e.g., well data, cores) or two-dimensional (outcrops, 2D seismic sections). Humans in general, and geologists in particular tend to look for evidence where the light is better, and we are tempted to think that the beautiful core we have described, the one good outcrop face we have, the one textbook-quality seismic line on our wall is a good representation of the geology and stratigraphy of a much broader area, and that one can build a coherent story without knowing much about the third dimension.

That, of course, may well be true of ‘layercake’ stratigraphy: after all, a single thickness value can be used to fully characterize the geometry of a layer that has the same thickness over a large area. But, as Brian points out, ‘layercake stratigraphy’ should be considered an oxymoron: every sedimentary layer shows some thickness variations if traced for a long enough distance, even if some layers change their thickness more slowly than others. Stratigraphy is only layercake-like for human observers; subtle but persistent variations in thickness and relief can become striking geometries with some vertical exaggeration. Again, if this variation only occurred in one direction, a two-dimensional section along the same direction would summarize very well the whole story.

However, complex three-dimensionality is the rule rather than the exception in geology. Take for example a meandering river: its geometry is complex enough as it is, a single snapshot of a snaky morphology in time. But try imagining what happens as point bars and levees are deposited and cutbanks are cut; the channel changes its position over time and, over thousands and hundreds of thousands of years, it leaves behind an extremely complicated stack of deposits that would probably be difficult to fully understand even if you somehow could see and describe everything at the greatest detail in 3D. Obviously, a nice outcrop or a number of cores through such a deposit can provide a wealth of information, but we would be fooling ourselves if we thought that a single fining-upward sequence with some cross-bedding (that is, the classic point-bar facies model) was enough to understand a fluvial system.

But strong three-dimensionality is not restricted to fluvial deposits; look at any present-day depositional system in Google Earth and you will find that alluvial fans, deltas, barrier islands and tidal inlets, wind-blown dune fields are all intricate patterns, usually with lines running in more than one direction. Yet many of the classic facies and stratigraphic models are either one- or two-dimensional. Maybe, probably, these are necessary and useful simplifications and conceptual models, but they can only be useful if one is also aware how far they are from capturing the full 3D complexity of nature.

That being said, I have to add that 3D is not always better than 2D. Nowadays, some of the best three-dimensional geological datasets are 3D seismic surveys, and, with the increasing availability of such gold-mines of stratigraphic beauty (there are other uses as well, but let’s focus on one thing for now 🙂 ) it is easy to fall victim to the temptations of colorful three-dimensional displays. Despite claims like ‘3D interpretation and visualization are the future’, the truth is that a good set of old-fashioned maps and cross sections are more valuable in the long term than some glossy presentation slides with no exact spatial location.

Unless, of course, you can visualize and share your data relying on an easy-to-use and truly three-dimensional viewer. Like Google Earth. Even William Smith would be excited about that.


Detail from “Geological view and section through Dorsetshire and Somersetshire to Taunton, on the road through Yeovil toWimborn[e] Minster, &c.”, by William Smith, 1819. Source: Oxford Digital Library

Geo-highlights from Hindered Settling 2007

It is kind of late to do this 2007 retrospective, but what the heck. As pointed out by Ron, 2007 has been the year when a real geology blogger community started to develop. The evolution of Hindered Settling from an eclectic mix of notes about science, geology, skepticisim, atheism, technology, etc., written in Hungarian and in English (or Hunglish?), to a much more geoscience-oriented, English-only site is in part the result of this trend.

So here are a few posts from 2007 that I think should be on this list:

Photos from Brazos Bend State Park – if you live in Houston, Brazos Bend State Park is one of the best places to get away from the city and see some wildlife & nature. No mountains, of course, but at least you can look at oxbow lakes and learn about photography. For some reason, the photos I have taken there over the years have become fairly popular.

On the Great Unconformity, James Hutton, and Geologic Time

Photos and impressions from a stunning glacial lake and delta in the Canadian Rockies, with some sedimentology mixed in

On flame structures

Sedimentology on Mars
– wet or dry gravity flows?

Thoughts about the Black Sea flood and its potential link to the spread of agriculture in Europe

Absurd catastrophism

If there was an icon for ‘blogging on non-peer-reviewed non-research’, in the style of ‘blogging on peer-reviewed research’, this post would qualify for it. Although it is advertised as publishing “cutting-edge, peer-reviewed, creationist research papers”, Answers Research Journal (published by Answers in Genesis) is definitely not cutting-edge, not peer-reviewed, and is clearly not research. The evidence: the first few materials that are available online. There is a paper on “catastrophic granite formation”; here is a passage that gives you a flavor:

“Thus the formation of granite intrusions in the middle to upper crust involves four discrete processes — partial melting, melt segregation, magma ascent, and magma emplacement. According to conventional geologists (Petford et al. 2000), the rate-limiting step in this series of processes in granite magmatism is the timescale of partial melting (Harris, Vance, and Ayres 2000; Petford, Clemens, and Vigneresse 1997), but “the follow-on stages of segregation, ascent, and emplacement can be geologically extremely rapid – perhaps even catastrophic.” However, as suggested by Woodmorappe (2001), the required timescale for partial melting is not incompatible with the 6,000–7,000 year biblical framework for earth history because a very large reservoir of granitic melts could have been generated in the lower crust in the 1,650 years between Creation and the Flood, particularly due to residual heat from an episode of accelerated nuclear decay during the first three days of the Creation Week (Humphreys 2000; Vardiman, Snelling, and Chaffin 2005). This very large reservoir of granitic melts would then have been mobilized and progressively intruded into the upper crust during the global, year-long Flood when the rates of these granite magmatism processes would have been greatly accelerated with so many other geologic processes due to another episode of accelerated nuclear decay (Humphreys, 2000; Vardiman, Snelling, and Chaffin 2005) and catastrophic plate tectonics (Austin et al.1994), the likely driving mechanism of the Flood event.”

Here is what I honestly do not understand. Let’s accept for a moment the idea that granites can form relatively fast, and pretend that radioactive dating has some major issues, as these people claim (it doesn’t, of course), so that all the granites on Earth fit the 6000-year timeframe. But what about the stuff that the granites were generated from? That must be older, right? And if the whole crust is less than a few thousand years old, what about the mantle? And, if one can speculate about “accelerated nuclear decay during the first three days of the Creation Week” or “catastrophic plate tectonics”, why not just say that granites were created on the second day, after the mantle was ready to start convection by the end of the first day? Or, even better and simpler (Occam’s razor!), why not just come up with something like:

And God said, Let there be granite: and there was granite. And God saw the granite, that it was good: and God divided the crust from the mantle.

I am looking forward to the time when somebody realizes that the Universe was created yesterday, and it is only an illusion that we have been around for a bit longer than that. Imagine all the wonderful research opportunities that such a revolutionary working hypothesis would generate. I can already see papers and headlines like:

Updated relativity theory shows that time is shorter than you think

Plate tectonic hit-and-run: after hitting North America yesterday with several microcontinents, the Pacific Plate continued to subduct as if nothing happened

Fossil record from 4:15 pm yesterday shows that lightning-fast giant snails were abundant on Earth for more than 7 minutes

Accelerated ice flow during the last few minutes of Creation Hour is likely responsible for death of Ötzi the iceman

Scuba diver killed by massive rain of pelagic forams

Catastrophic hair growth in early humans

Additional research ideas are welcome; ‘Answers Research Journal’ is calling for papers now.

UPDATE: In my rush to publish the above results, I forgot to mention some previous work on similar subjects: Afarensis – an expert in points to the Precambrian archaeology –ist, who suggested long ago that the Cambrian explosion was caused by a bacteria trying to form a synthesis with a mitochondria and that peanut butter is a leftover from this explosion. I would only add that there is new evidence suggesting that the Precambrian started at 1 am yesterday, after Creation Hour ended, and it probably lasted for several hours, until the bacteria committed adultery.

Catastrophic flooding of the Black Sea and the expansion of agriculture in Europe

ResearchBlogging.orgBoth Ole and Chris have blogged about a new paper, published in Quaternary Science Reviews, that discusses the link between the catastrophic inundation of the Black Sea and the expansion of agriculture in Europe during the Neolithic. I am not going to repeat what they already summarized well; I only want to expand a bit on what I see as the weak points of the Black Sea flood story. [Disclaimer: I am not an expert in the geology and stratigraphy of the Black Sea, and even less of an expert in archaeological matters].

While the recently published Turney & Brown paper presents some nice data and argues convincingly that the start of Neolithic expansion in Europe roughly coincides with the ~8300 yr BP age estimate for the catastrophic flooding of the Black Sea, this correlation does not necessarily suggest a cause-and-effect relationship. The question is still open: yes, the flooding might have caused the migration, but it is also possible that the two events are independently related to the same climatic changes. Very few of the radiocarbon dates, representing the earliest Neolithic sites in Europe, come from the territory of present-day Romania, yet one would expect that the low-lying areas along the lower Danube River would be the first places to be colonized by the population forced out from the inundated shelves of the Black Sea that are the widest east of the Danube Delta. Why are early Neolithic settlements so scarce in this area, which is good for agriculture? In their 1998 book, Ryan and Pitman suggest that Vinca farmers showed up abruptly along the Danube valley, soon after the flooding occurred. The earliest Vinca settlements however are dated at 7500 yr BP, so there is a gap of a few hundred years between the flood and these first settlements. That seems too long; in addition, even if the initial displacement of people living near the Black Sea resulted in the expansion of agriculture into Southeastern Europe, it is questionable how much effect this flooding had on the spread of Neolithic people into Northwestern Europe. It is unlikely that the main motivation to cross the English Channel for people living in today’s Northern France was that their ancestors were scared off the shores of the Black Sea many hundreds of years before.

The image below is a screenshot from Google Earth, showing the data published by Turney and Brown. The Neolithic locations are color-coded according to their age, red being the oldest, and dark blue being the youngest. The KMZ file (made with GPS Visualizer and some help from Matlab) is available here.


Regarding the link between the Black Sea flood and Noah’s story — I think it is an interesting idea, but not much more. There were and there will be numerous large floods that affect human lives and human history, and the one featured in the Bible is so generic that it will be difficult to unequivocally link it to any specific event. In addition, the catastrophic flooding of the Black Sea might have been catastrophic only in a geological sense; calculations suggest that it took 34 years to erase the 155 m difference in water level between the Black Sea and the Mediterranean. The slow and relentless rise of the sea must have been disquieting and annoying to people living close to the shore, but, unless they built their huts in the middle of the Bosporus, it probably was not as traumatic for most of them as Hurricane Katrina was for lots of Gulf Coast residents.

The recent (I mean geologically recent) history of the Black Sea region is certainly fascinating and the controversy surrounding the exact sequence and nature of the events can only result in more top-notch oceanographic and archeologic research. And that is always exciting.