Memorable moments and photos from 2013

We are well into 2014 now, but it is not too late to look back at 2013 and pick some of the best moments (which means photos in my case) of the year that just passed.

We started out the year with a trip to Zion and Bryce Canyon National Parks. Although it was fairly cold (especially at Bryce Canyon NP — this park has a much higher elevation overall than Zion NP), we had lots of sunshine and did several day hikes. Visiting these parks in the winter is a great idea — they are a lot less crowded than in the summer, and obviously the landscapes and sights are quite different when they are covered with snow.

Zion National Park is paradise for a sedimentologist: there are endless, top-quality exposures of the Navajo Sandstone, showing all kinds of sedimentary structures characteristic of deposits of wind-blown sand. I have included two examples here; you can find more on my Smugmug site.

Sedimentologically, Bryce Canyon National Park is a bit less exciting than Zion, but this is counterbalanced by the fantastic geomorphology of this place. I haven’t seen Bryce Canyon in the summer, but I wouldn’t be surprised if it was more beautiful when it’s covered with snow.

In February, I went on a ‘business’ trip to Torres del Paine National Park in Southern Chile: I attended a field consortium meeting organized by Steve Hubbard’s group at the University of Calgary. I have been to this area several times before, as it has some of the best outcrops of turbidites (= deep-water sediments) in the world, but I was once again shocked how uniquely beautiful Chilean Patagonia can be.

At the end of the official trip, Zane Jobe (who is blogging at Off the Shelf Edge) and I did a bit of geo-turism: we went to see Glacier Grey and Lago Grey, and then did a day hike in the park to check out the actual Torres del Paine. The rest of the photos are here.

In July, my wife and I took a few days to do some hiking and running in Rocky Mountain National Park. I was struggling with a running injury at that time, but the mountains and the trails acted as efficient tranquilizers. More photos at Smugmug.

In September I attended a research conference on turbidity currents in Italy and Peter Talling showed us some of the classic outcrops of the Marnoso-Arenacea Formation. These rocks are very unique because they were deposited by huge submarine flows that covered the entire basin floor. Always wanted to see them and it was enlightening to get up close to them.

DSC_6304

Turbidites of the Marnoso-Arenacea Formation, Italian Apennines. David Piper and Bill Arnott for scale

In October we spent a long weekend in Moab, Utah, to participate in our first trail races, but we also did some hiking. Running the Moab Trail Marathon was an amazing experience (I think I will have to do it again this year); unfortunately I didn’t take a camera with me, as I was trying to focus on running (and surviving the race).

DSC_6470

Typical view in Canyonlands National Park

To continue with the theme of ‘national parks in winter’, some friends from California and the two of us wrapped up the year with a Christmas trip to Yellowstone and Grand Teton National Parks. More photos, of course, at Smugmug.

My job description, in simple words

I couldn’t refrain from playing with the ‘upgoerfive’ tool, an online text editor that only allows you to use the one thousand most common words of the English language. Here is my attempt to describe what I do.

I study how small pieces of rock get together, move along, and settle down to form beds. Water usually moves smaller pieces further than large ones but lots of small and big pieces together can move really fast and build thick beds on the water bottom. I also look at the form of these beds and think about how much space is left in between the small pieces. This space is filled with water and sometimes with other stuff that people like to burn in their cars. It is nice that such beds are often seen in beautiful places around the world that I like to visit.

Here is the link to the original upgoerfive post. You can try it out yourself over here.

The case for scales, rates, and numbers in geology

A long time ago I used to study geology in a nice city called Cluj, in the middle of that interesting part of Romania known as Transylvania. This was a place and time where and when I learned about quartz, feldspar, species of coral and foraminifera in great detail, heard about sequence stratigraphy and turbidites for the first time, and went on some great geological field trips. Not to mention the half-liter bottles of beer that would be significant components of any decent geological trip or spontaneous philosophical discussion in the evening. The less pleasant part was that many of the classes I took involved brute-force memorization of fossils, minerals, chronostratigraphic names, and formations. Although the geological vocabulary that I picked up was pretty broad and proved useful as a good set of words, terms, and definitions to play with, I forgot many of the details by now. If you asked me what was the difference between granite and granodiorite, I would have to check. I don’t remember at all what fossils are characteristic of the Late Jurassic. And, despite doing some fieldwork myself over there, I cannot remember the stratigraphic nomenclature in Transylvanian Basin; I would have to look it up (probably in this paper).

After college, it took me about one year to realize with convincing clarity that there was a lot left to learn. I went on to grad school on the other side of the planet, at a well-known university. Many of the classes I took over there were – unsurprisingly – quite different; a lot more focus on laws, processes and the connections between geological things than the ‘things’ themselves. It was also there that I started to see the links between geology and physics and math. I picked up quite a bit of math and physics during high school, but then quickly relegated them to the status of “stuff that is rarely used in geology”. At grad school, it dawned on me that numbers and mathematical laws are not only useful in geology, but are in fact necessary for doing good earth science. Maybe I am stating the obvious, but here it goes anyway: geology deals with enormous variations in scale, both in space and time; and it is not enough to say that the river was deep (how deep?), the tectonic deformation was fast (how fast?), the sea-level highstand lasted long (how long?), or the sediment gravity flows were high-energy flows (I am not even sure what that means). One of the most important things I learned was an appreciation for physical and quantitative insight in geology, that is, having at least an idea, a feel for what are the scales and rates involved in the formation of the rocks you are looking at. I cannot say it better than Chris Paola, one of the important and influential advocates of moving sedimentary geology closer to physics and math:

“For the ‘modal’ sedimentary-geology student, it is not sophisticated computational skills or training in advanced calculus that is lacking, but rather the routine application of basic quantitative reasoning. This means things like estimating scales and rates for key processes, knowing the magnitudes of basic physical properties, and being able to estimate the relative importance of various processes in a particular setting. Understanding scales, rates and relative magnitudes is to quantitative science what recognizing quartz and feldspar is to field geology. Neither requires years of sophisticated training, but both require repetition until they become habitual.”

Developing these skills is a lot easier if one is not afraid of tinkering with simple computer programs. Want to really understand what Stokes’ law is about? There is no better way than typing the equation into an Excel spreadsheet or a Matlab m-file and see how the plot of settling velocity against grain size looks like. What about settling in a fluid with different viscosity? Change the variable, and compare the result with the previous curve. High-level programming languages like Matlab or Python* are a lot easier to learn than languages closer to ‘computerese’ and farther from English, and they are great tools for these kinds of exercises and experiments. As somebody interested in stratigraphic architecture, I have become especially fond of creating surfaces that vaguely resemble real-world landscapes and then see how the evolution of these surfaces through time – deposition over here, erosion over there – creates stratigraphy. Complex three dimensional geometry is a lot easier to grasp if you can visualize and dissect it on the computer screen.

Of course, numbers, diagrams and images that come from computer programs are only useful if they demonstrably say something about the real world. Data collection in the field and the laboratory are equally important. But nowadays we often have more data than we wished for, and quantitative skills come handy for visualizing and analyzing large datasets – and comparing them to models.

Not everyone is excited about the growing number of earth scientists who tend to see equations ‘in the rocks’. The logo of the Sedimentology Research Group at the University of Minnesota features the Exner equation carved into a pebble, allegedly as a response to the exclamation “I haven’t seen yet an equation written on the rocks!” There is some concern that many geology graduates nowadays do not get to see, to map and to sample enough real rocks and sediments in the field. Although I think this unease is not entirely unsubstantiated, I wouldn’t want to sound as pessimistic as Emiliano Mutti – one of the founding fathers of deepwater sedimentology – does in the last phrase of a review article:

“This approach raises a problem, and not a small one: in connection with data collection in the field, how many field geologists are being produced in these times of increasingly computerized geology; and how good are they?”

As far as I know, geological field work is still an important part of the curriculum in many departments of geology – as it clearly should be. The number one reason I have become a geologist was that I loved mountains, hiking, and being outdoors in general, way before I started formally studying geology. And I still take every opportunity to go to the field. But I cannot see the growth of “computerized geology” – and of quantitative geology in general – as a bad thing. Does dry quantification take away the beauty and poetry of geology? I don’t think so. Unweaving the rainbow, unfolding a mountain, and reconstructing a turbidity current only add to our appreciation of the scale and grandeur of geology.

* I will let you know later whether this is true about Python…

** I have started writing this post for Accretionary Wedge #38, mostly because I found the call for posts quite inspiring, but haven’t finished it in time. Read all the good stuff at Highly Allochthonous.

The complexity of sinuous channel deposits in three dimensions

ResearchBlogging.org The beauty of the shapes and patterns created by meandering rivers has long attracted the attention of many geomorphologists, civil engineers, and sedimentologists. Unless they are fairly steep or have highly stable and unerodible banks, rivers do not like to follow a straight course and tend to develop a sinuous plan-view pattern. The description and mathematical modeling of these curves is a fascinating subject, but that is not what I want to talk about here and now. It is hard enough to understand the plan-view evolution of rivers, especially if one is interested in the long-term results – when cutoffs become important -, but things get really complicated when it comes to the three-dimensional structure of the deposits that meandering rivers leave behind. The same can be said about sinuous channels on the seafloor, created and maintained by dirty mixtures of water and sediment (called turbidity currents). An ever-increasing number of seafloor and seismic images show that highly sinuous submarine channels are almost as common as their subaerial counterparts, but much remains to be learned about the geometries of their deposits that accumulate through geological time.

Using simple modeling of how channel surfaces migrate through time, two recent papers attempt to illustrate the three-dimensional structure of sinuous fluvial and submarine channel deposits. In the Journal of Sedimentary Research, Willis and Tang (2010) show how slightly different patterns of fluvial meander migration result in different deposit geometries and different distribution of grain size, porosity and permeability. [These properties are important because they determine how fluids flow – or don’t flow – through the pores of the sediment.] River meanders can either grow in a direction perpendicular to the overall downslope orientation, or they can keep the same width and migrate downstream through translation. In the latter case – which is often characteristic of rivers incising into older sediments -, deposits forming on the downstream, concave bank of point bars will be preferentially preserved. These deposits tend to be finer grained than the typical convex-bank point bar sediments. In addition to building a range of models and analyzing their geometries, Willis and Tang also ran simulations of how would oil be displaced by water in them. One of their findings is that sinuous rivers that keep adding sediment in the same area over time (in other words, rivers that aggrade) tend to form better connected sand bodies than rivers which keep snaking around roughly in the same horizontal plane, without aggradation.

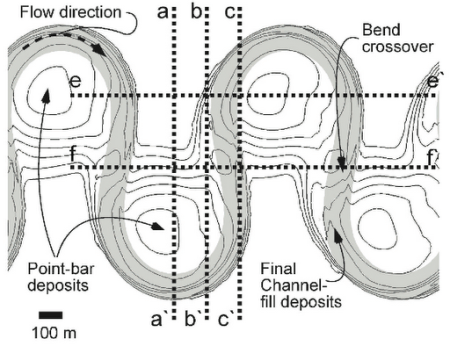
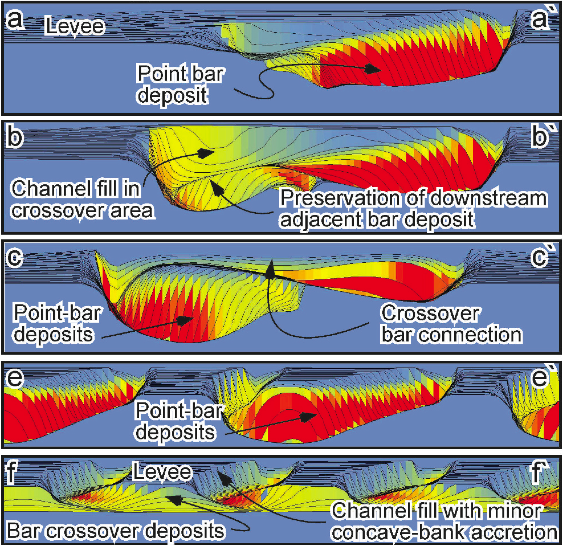
Map of deposits forming as river meanders grow (from Willis and Tang,  2010).
Cross sections through the deposits of two meander bends (locations shown in figure above). Colors represent permeability, red being highly permeable and blue impermeable sediment. From Willis and Tang, 2010.

Check out the paper itself for more images like these, plus discussions of concave-bank deposition, cutoff formation, and filling of abandoned channels.

The second paper (Sylvester, Pirmez, and Cantelli, 2010; and yes, one of the authors is also the author of this blog post, so don’t expect any constructive criticism here) focuses on submarine channels and their overbank deposits, but the starting point and the modeling techniques are similar: take a bunch of sinuous channel centerlines and generate surfaces around them that reflect the topography of the system at every time step. However, we know much less about submarine channels than fluvial ones, because it is much more difficult to collect data at and from the bottom of the ocean than it is from the river in your backyard. The result is that some of the simplifications in our model are controversial; to many sedimentary geologists, submarine channels and their deposits are fundamentally different from rivers and point bars, and there is not much use in even comparing the two. Part of the problem is that not all submarine channels are made equal, and, when looking at an outcrop, it is not easy – or outright impossible – to tell what kind of geomorphology produced the  stratigraphy. In fact, the number of exposures that represent highly sinuous submarine channels, as observed on the seafloor and numerous seismic images, is probably fairly limited. One thing is quite clear, however: many submarine channels show plan-view migration patterns that are very similar to those of rivers, and this large-scale structure imposes some significant constraints on the geometry of the deposits as well.

That being said, nobody denies that there are plenty of significant differences between real and submarine ‘rivers’ [note quotation marks]. A very important one is the amount of overbank – or levee – deposition: turbidity currents often overflow their channel banks as thick muddy clouds and form much thicker deposits than the overbank sediment layers typical of rivers. When these high rates of levee deposition combine with the strong three-dimensionality of channel migration, complex geometries result that are quite tricky to understand just by looking at a single cross section.

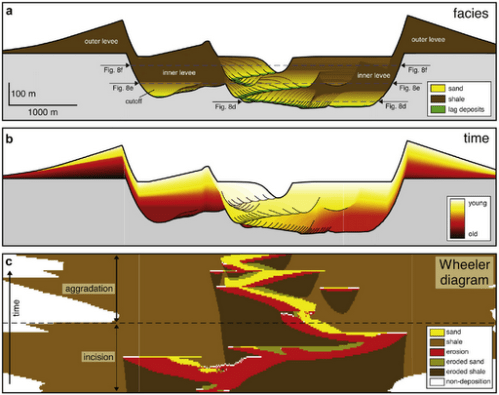
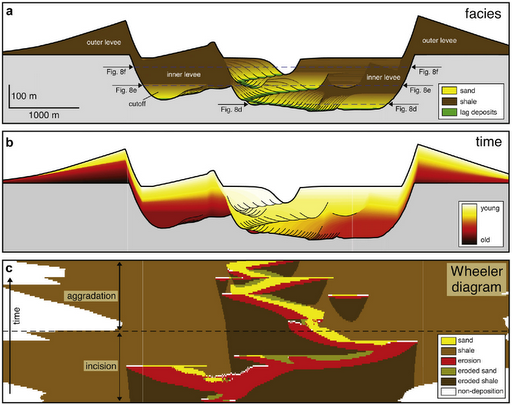
Cross section and chronostratigraphic diagram through a submarine channel system with inner and outer levees (from Sylvester et al., 2010).

One of the consequences of the channel migration is the formation of erosional surfaces that develop through a relatively long time and do not correspond to a geomorphologic surface at all (see the red erosional zones in the Wheeler diagram above). This difference between stratigraphic and geomorphologic surfaces is essential, yet often downplayed or even ignored in stratigraphy. In terms of geomorphology, the combination of channel movement in both horizontal and vertical directions and the extensive levee deposition results in a wide valley with scalloped margins and numerous terraces inside:

Three-dimensional view of an incising channel-levee system (from Sylvester et al., 2010).

This second paper is part of a nice collection focusing on submarine sedimentary systems that is going to be published as a special issue of Marine and Petroleum Geology, a collection that originated from a great conference held in 2009 in Torres del Paine National Park, Southern Chile.

PS. As I am typing this, I see that Brian over at Clastic Detritus is also thinking about submarine channels and subaerial rivers… Those channels formed by saline density currents on the slope of the Black Sea are fascinating.

Willis, B., & Tang, H. (2010). Three-Dimensional Connectivity of Point-Bar Deposits Journal of Sedimentary Research, 80 (5), 440-454 DOI: 10.2110/jsr.2010.046

Sylvester, Z., Pirmez, C., & Cantelli, A. (2010). A model of submarine channel-levee evolution based on channel trajectories: Implications for stratigraphic architecture Marine and Petroleum Geology DOI: 10.1016/j.marpetgeo.2010.05.012

Geo-highlights from Hindered Settling 2007

It is kind of late to do this 2007 retrospective, but what the heck. As pointed out by Ron, 2007 has been the year when a real geology blogger community started to develop. The evolution of Hindered Settling from an eclectic mix of notes about science, geology, skepticisim, atheism, technology, etc., written in Hungarian and in English (or Hunglish?), to a much more geoscience-oriented, English-only site is in part the result of this trend.

So here are a few posts from 2007 that I think should be on this list:

Photos from Brazos Bend State Park – if you live in Houston, Brazos Bend State Park is one of the best places to get away from the city and see some wildlife & nature. No mountains, of course, but at least you can look at oxbow lakes and learn about photography. For some reason, the photos I have taken there over the years have become fairly popular.

On the Great Unconformity, James Hutton, and Geologic Time

Photos and impressions from a stunning glacial lake and delta in the Canadian Rockies, with some sedimentology mixed in

On flame structures

Sedimentology on Mars
– wet or dry gravity flows?

Thoughts about the Black Sea flood and its potential link to the spread of agriculture in Europe

Meme of Four

Well, Hindered Settling got a bit too settled lately, so it’s time to shake it up. Brian’s tagging is a good excuse to do that, even though some of this may be too much detail. Here it goes, anyway.

4 jobs you’ve had:
1. teaching assistant (yes, it was a full time job in Romania)
2. does graduate work count as a job?
3. does serving in the Romanian Army count as a job? (probably no)
4. petroleum geologist

4 movies you could watch over & over:
1. Sideways
2. The Lives of Others
3. Annie Hall
4. Black Cat, White Cat

4 places you’ve lived:
1. Sfantu Gheorghe, Romania
2. Cluj, Romania (both #1 and 2 are in Transylvania as well)
3. Portola Valley, California (quite a change)
4. Houston, Texas (quite a change, again)

4 TV shows you love to watch:
1. Seinfeld
2. Extras
3. The Daily Show
4. Kitchen Nightmares (I admit it, too)

4 places you’ve been on holiday vacation:
1. Tuscany
2. Canadian Rockies
3. Paris
4. Yellowstone

4 authors you love to read:
1. Richard Dawkins
2. Steven Pinker
3. Bill Bryson
4. Jared Diamond

4 websites you visit daily:
1. Scienceblogs
2. New York Times
3. Macworld
4. RichardDawkins.net

4 of your favorite foods:
1. Avocado (I hated it a few months ago)
2. Pasta
3. Stuffed cabbage (Transylvanian style)
4. Cheese, mainly Italian

4 places you’d rather be:
1. skiing anywhere
2. in the Vargyas Valley (in Transylvania)
3. San Francisco
4. tasting wine, anywhere

4 lucky people to tag:
no tagging, but – of course – feel free to get and spread the meme

Blogvilági multikulturalitásom vége…

…elérkezett, legalábbis ami az olvasóimat illeti. Olvasóim nagy része ugyanis (ezt úgy mondom, mintha olyan sok olvasóm lenne) vagy csak az angol bejegyzéseket olvassa el, vagy csak a magyarul írottakat. A tisztelt kivételnek ezután két blogot kell majd követnie: esetleges anyanyelvű gondolataimat ugyanis ezután nem itt fogom képernyőre vetni, hanem a WordPress-nél. Az új-régi blog címe “Hegyek, fák, kövek”, és az új cím http://zsylvester.wordpress.com.

My blogospheric Multiple Personality Disorder is over

… well, at least for my readers. From now on, ‘Hindered Settling’ will only feature blog posts in English (or Hunglish, a hungarianized version of it), but those of you (all five of you 🙂 ) who from time to time had to think “ok, one of those posts in some weird Eastern European language again” will not have to do so any more (apart from the last one above). My Hungarian ego has decided to move to WordPress. If you are interested in weird Eastern European languages, you can check it out here.

A média jövője jelene


Apróság, de muszáj megemlíteni: azt írja a július hetedikei Szabadság, a “Tudományos-fantasztikus: a média jövője” című cikkben, hogy

A technika-guruk jóslatai szerint nemsokára a mobiltelefon lesz az a műszer, amelyről egyszerre lehet majd videót nézni, zenét hallgatni, internetezni, chattelni – vagy éppen saját tartalmat készíteni és azt feltölteni a világhálóra.

Nemsokára? Ugyan-ugyan. Ez nem a média jövője, és nem tudományos-fantasztikus elmélkedés, hanem valóság.

A cikkben emlegetett mobiltelefonra egy lehetséges példa az iPhone. Ráadásul már az iPhone előtt is voltak “okos” telefonok, amelyek mindenre képesek, amik a cikkíró szerint csak a technika-guruk jóslataiban léteznek. Az más kérdés, hogy engem igazán csak az iPhone óta kezdett a mobiltelefon-téma igazából érdekelni. Ha idővel még GPS-t is tesznek rá, a Google Maps mellé, akkor valóban ez lesz az egyik legizgalmasabb és élvezetesebb szerkentyű.

A Tarkői Homokkő a Sedimentology borítóján

Az agusztusi Sedimentology borítóján látható fotó a Bodza völgyében készült, még akkoriban, amikor alulírott arrafele méricskélte a homokköveket. Mint sok zöldfülű doktorandusz, nem igazán tudtam akkor, hogy mire is lesz majd jó a sok rétegtani szelvény, de utólag találtam a válaszra kérdést, és most fordított sorrendben a kérdés és a válasz is benne vannak ugyanabban a Sedimentology számban.

Ha valakit esetleg érdekel — a cikk lényege az, hogy a bodza-völgyi rétegvastagságokat legjobban a lognormális eloszlással lehet jellemezni, annak ellenére, hogy egyesek szerint a hatványfüggvény-eloszlás (vagy fraktáleloszlás) a domináns a turbiditeknél. A fraktáleloszlás valóban izgalmas, de csak akkor, ha van rá jó bizonyíték — de sok esetben a bizonyíték hiányzik, és egy egyszerű log-log grafikon alapján egyesek hajlamosak fraktálnak nyílvánítani mindent.

A Tarkői Homokkő – és az olaszországi Marnoso-Arenacea Formáció – esetén világosan kimutatható, hogy a lognormális eloszlás jellemzi a vastagon és a vékonyan rétegzett turbiditeket egyaránt. És nem csak a statisztikai elemzés mutatja ezt, hanem valahogy filozofálgató szinten is szimpatikusabb nekem ez a “megoldás”, mint akár a fraktáleloszlás, akár az exponenciális eloszlás, még akkor is, ha ez utóbbiak izgalmas spekulálgatásokra adnak okot, skála-független fizikáról, Poisson folyamatokról, meg önszerveződő kritikalitásról (angol “self-organized criticality”).

Na, ez kezd nagyon posztmodernül hangzani, úgyhogy jobb, ha abbahagyom.