Where on Google Earth #62

With some help from Wikipedia, I found that the image posted by Joe was from a volcanic field in western Sudan. So here comes WoGE #62.


Compared to the Peruvian meanders, this should be easy. Extra points for knowing the story that this place is a good example of — there is a specific journal article I am thinking about.

Schott rule in effect (post time 8:22 pm CST, 10-17-07).

Update: Brian has the answer; here is a bit more detail about this image. It’s the southernmost distributary of the Danube Delta in Romania, called the Sfantu Gheorghe channel. The geometry of the deposits is determined by (1) the river discharge, (2) the wave energy of the Black Sea, and (3) the southward oriented longshore transport. The asymmetry of the lobe is a function of the ratio between the net longshore transport rate at the mouth and river discharge. The longshore currents erode the beach/barrier bars on the northern side of the channel mouth. More details in this paper. This image also comes from Bhattacharya and Giosan (2003):


Black represents sand, gray is predominantly muddy deposits, and the white arrow at the river mouth shows the direction of longshore drift.

The importance of numbers in sedimentary geology

A few years ago, Chris Paola published a paper in Sedimentology on “Quantitative models of sedimentary basin filling”. I was skimming through it today, and found these thoughts about the role and status of quantitative reasoning in sedimentary geology:

…what is needed is researchers who are skilled in the field but at the same time understand what quantitative modelling is about: why and how people make approximations, why approaches to modelling can and must differ, and, above all, what the mathematics in the models mean physically. Just as there is no substitute for experience in learning to work in the field, there is no substitute for experience in developing physical insight. And there is no shortcut: we need researchers who are good at at both traditional, descriptive geology and quantitative geology. For the ‘modal’ sedimentary-geology student, it is not sophisticated computational skills or training in advanced calculus that is lacking, but rather the routine application of basic quantitative reasoning. This means things like estimating scales and rates for key processes, knowing the magnitudes of basic physical properties, and being able to estimate the relative importance of various processes in a particular setting. Understanding scales, rates and relative magnitudes is to quantitative science what recognizing quartz and feldspar is to field geology. Neither requires years of sophisticated training, but both require repetition until they become habitual.

And:

Some 30 years after the initial ‘physics scare’ associated with bedforms and sedimentary structures, a set of basic principles from fluid and sediment mechanics now appears routinely in introductory sedimentology textbooks. Popular items include settling velocity and Stoke’s Law, the Reynolds and Froude numbers, and the basic force balance for steady, uniform channel flow. This material is typically presented somewhere near the beginning of the book and then is largely ignored. (…) There remains a striking contrast between the role of fluid and sediment physics in sedimentary geology and that of thermodynamics in igneous and metamorphic geology. In ‘ig-met’ texts the underlying thermodynamic principles are introduced and then applied repeatedly. Whereas in hard-rock petrology, thermodynamics permeates the discipline, in sedimentary geology, sediment mechanics still seems a little like taking vitamins: it is surely good for you, but most people cannot say exactly why. There are several reasons for this. In current practice, process-based interpretation is often applied in a piecemeal, descriptive way, to no apparent end beyond providing the interpreter with one more adjective. In addition, the quantitative material that is traditionally taught more often not the most important. For instance, a real appreciation of the implications of the sediment-continuity equation as the governing relation for physical sedimentation is far more useful than the details of sediment-transport formulae or even the definition of the Reynolds number.

Although I still have a lot to learn myself, I couldn’t agree more.

ps. Check out what Lord Kelvin had to say about the importance of numbers in science.

Where on (Google) Earth #57

I figured out that the Google Earth image posted by Kim was cut by a famous fault, so I have a chance to post the next installment of Where on (Google) Earth. I don’t think this is easy – it is certainly not a famous geologic locality, and I know it would be tough for me. But I have been interested in erosional meanders for some time, so here you go. North is up.

Update — hint: it is in a forearc basin.

New images from Mars: the idea of very recent watery flows is evaporating

A few months ago I commented on the fact that, despite numerous scientific and media reports, the existence of recent watery flows on Mars is far from being obvious or proven. While there are many rock formations exposed at the planet’s surface that clearly suggest flowing water some time in the ancient past – for example, the delta near Holden Crater -, many of the young gullies and debris fans have no unequivocal signatures of recent watery flows.

The high-resolution images with the relatively recent gullies were released in 2000, and a paper was published in Science about how these features suggest the presence of liquid water on the Martian surface. Last year, this idea seemed to get new support, in the form of some images taken in 2005 were showing sedimentary activity on crater walls, when compared to images shot a few years earlier.

(image from Malin Space Science Systems)
The problem is, as I said, that nothing in these images suggest unequivocally the presence of water. Geologist Allan Treiman published a paper in 2003 stating this, but at that time his views were representing the minority viewpoint. Needless to say, the news reports got rid of the last remaining uncertainties and doubts in the story, and presented it as if it was 100% sure that liquid water exists today on Mars.

Now there is new evidence that the recent watery flows are not so watery after all. Rather, they are probably dust avalanches, dry flows similar to the ones that occur on windblown dunes here on Earth. Such flows can only form on steep slopes, that are close to the angle of repose. The problem, of course, is complicated – as many problems in science are – and there is no simple answer. For example, in the image shown above, you can see a fan that has been reincised after its deposition by its own feeding channel, so that the latest active deposition occurs further downdip. Such erosional valleys are probably associated with turbulent flow, suggesting that these fans were probably deposited by watery flows. More recent images (see below) also show details of erosional channels that are suggestive of watery flows. Unless the dust avalanches were highly turbulent density flows, similar to some snow avalanches, and they were even able to cut channels. Again, I think there is no easy and obvious answer.

photo from NASA’s Planetary Photojournal
In any case, there are two new papers in Science on this subject, check them out if you have online access (I don’t 😦 ).

Flame structures


Flame structures are sedimentary structures that usually consist of upward-pointing flame-shaped finer-grained sediment tongues that protrude into coarser sediment (like sand). Almost invariably, the ‘flames’ are inclined in a downslope direction (in a paleogeographic sense, of course) — like in these two images from the Precambrian Windermere Group in the Canadian Caribou Mountains.


Flame structures are often interpreted as load structures: the overall higher-density sand sinks into the lower-density underlying shale. That would put flame structures into the category of Rayleigh-Taylor instabilities, which result from density inversion. In geology, one of the most important types of Rayleigh-Taylor instability is related to salt: if buried deep enough, the density of the compacting overlying sediment exceeds the density of salt, and the latter starts flowing upward, giving rise to salt diapirs. Salt diapirs often have mushroom shapes, typical of Rayleigh-Taylor instabilities.

The shapes of the flame structures above actually remind me more of the Kelvin-Helmholtz instability, which is related to shear (that is, different velocities) across a fluid interface, and can occur even if the densities are not inverted. K-H instabilities in the atmosphere can result in elegant clouds. K-H billows are common at the tops of turbidity currents, due to the shear between the static water column above and the moving sediment-laden current below. There is no reason why the instability could not occur at the base of the current as well, if the underlying sediment is still fluid enough, and the current itself is not too erosive.

Here is the classic picture of K-H billows at the top of a density current, from Van Dyke’s Album of Fluid Motion.


Clastic Detritus has more on flame structures.

Peyto Lake / Caldron Lake trail

[This is my last post about Peyto Lake, I promise.]

Here is a KMZ (= Google Earth) file for the trail that leads from the Peyto Lake viewing platform to Caldron Lake. It corresponds to the red line in the screenshot below. It is obvious that we never got to Caldron Lake…


You can also see some of the photos in Google Earth, if you download and open this file.

A day in a delta’s life

I did some hiking recently in the Canadian Rockies. There is some stunning mountain scenery over there, with glaciers, lakes of out-of-this-world colors, icecap-covered humongous peaks, abundant wildlife, and so on. But some of the most exciting finds for a sedimentologist/geologist like myself must be the beautifully developed deltas that enter the glacial lakes. ‘Enter’ is actually an euphemism here, because the rivers are slowly, but surely filling with sediment these magnificent bodies of water, and it is only a matter of a few hundred or thousand years before most of the average size lakes become relatively uninteresting flatlands.

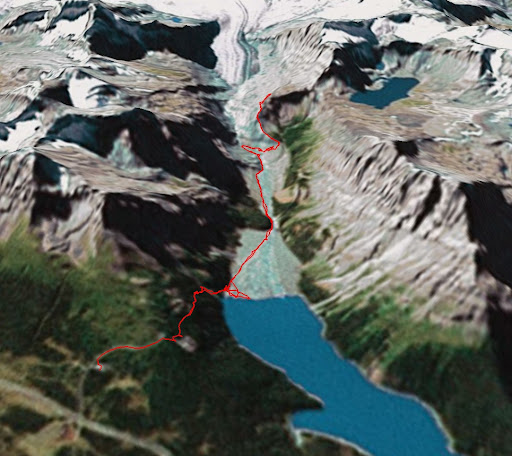
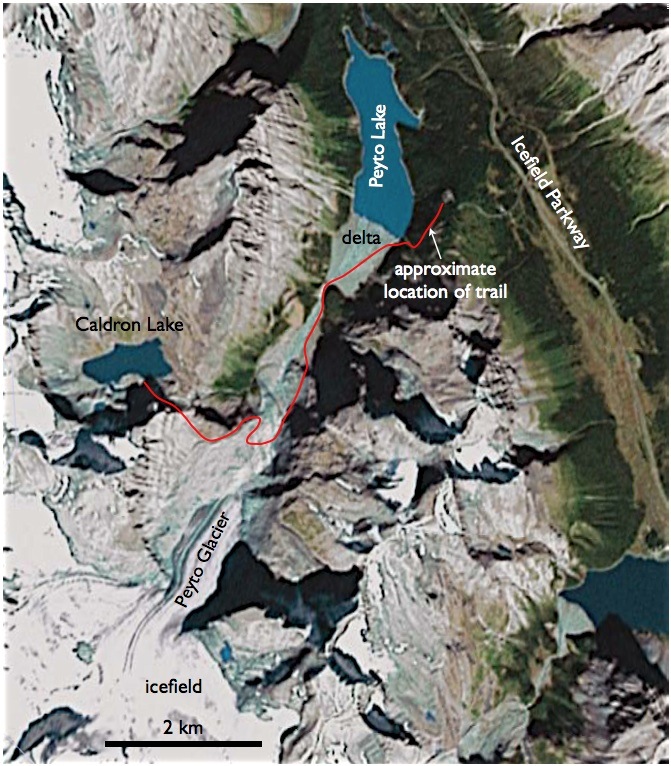
The delta at the updip end of the well-known (and somewhat overrated) Lake Louise is one of these lacustrine deltas. However, the one that really caught my attention is feeding into Peyto Lake. We got to the Peyto Lake overview area relatively early in the morning, when there was no wind, and the lake’s turquoise surface was perfectly smooth. Stunning view from high above, but most of my excitement evaporated (<– euphemism) when a busload of noisy (<– euphemism) tourists arrived and the viewing area suddenly felt like a Houston shopping mall on a weekend (<– exaggeration). So we started our descent toward the lake, on the trail that ultimately, if you are brave enough and rough enough (we were neither of these, but that is a different story), leads to Caldron Lake, above Peyto Glacier.

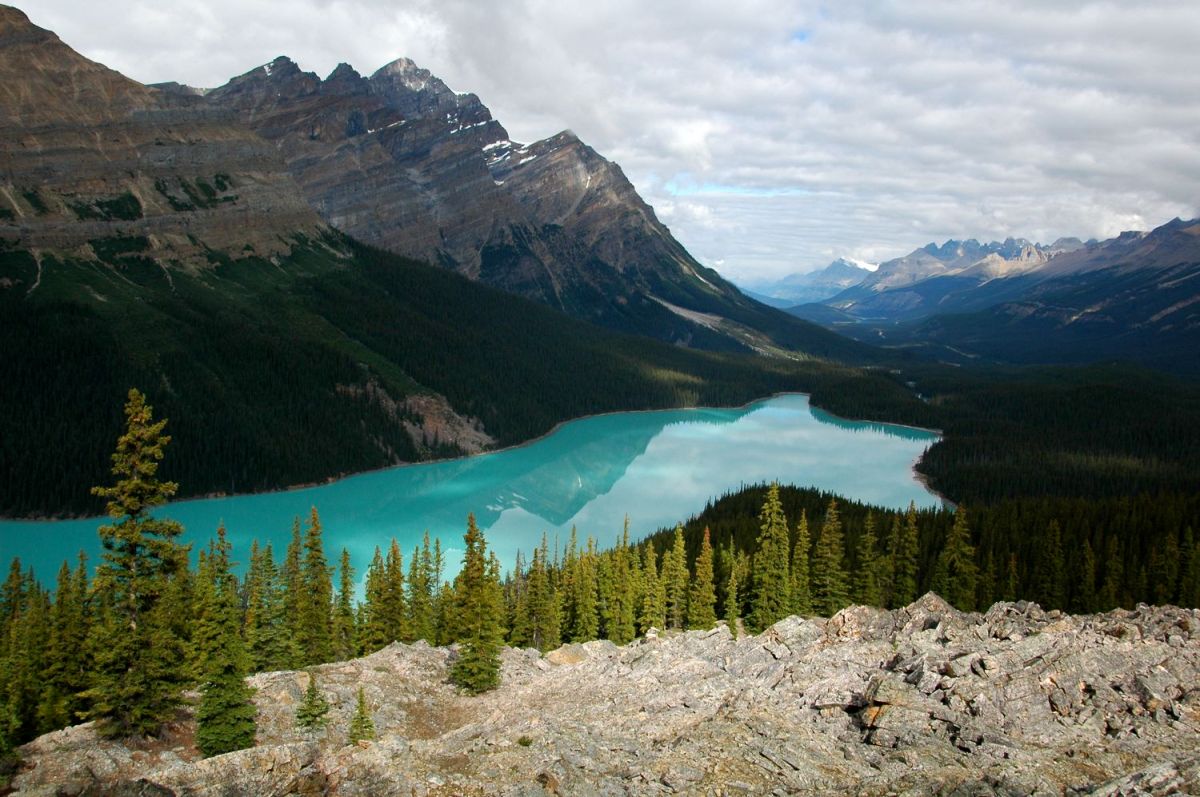
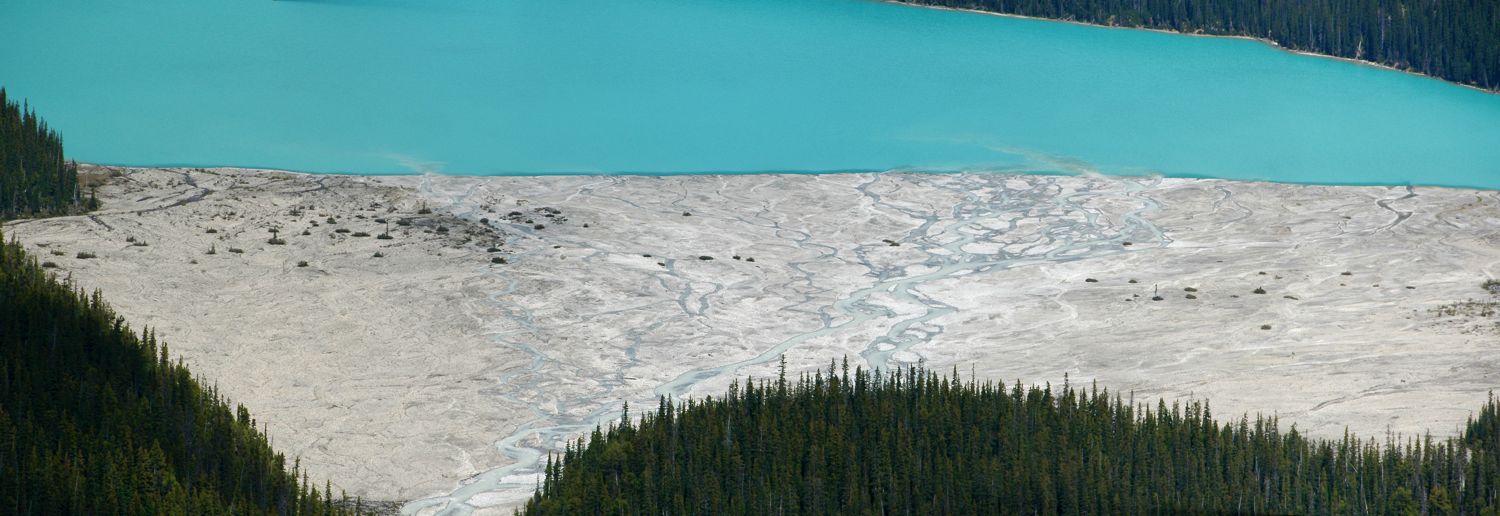
After only a couple of hundreds of meters, the population density dropped to zero, and my excitement not only went back to its previous levels, but exponentially grew as the lakehead delta started to take shape beyond the trees below us. You could see very well the active distributary channels sending slightly muddy or silty plumes into the lake. Because it was relatively cold, the glacier up in the valley was not melting too fast, and the discharge was small, so the plumes themselves seemed nice, but were barely noticeable.

This has changed during the day: as temperatures rose, the river that enters the lake became larger and larger, and by the time we got back to the lakehead delta in the afternoon, the plumes became much larger and much more evident.

The discharge of the river coming from the Peyto Glacier increases during the day and sends larger plumes into the lake in the afternoon


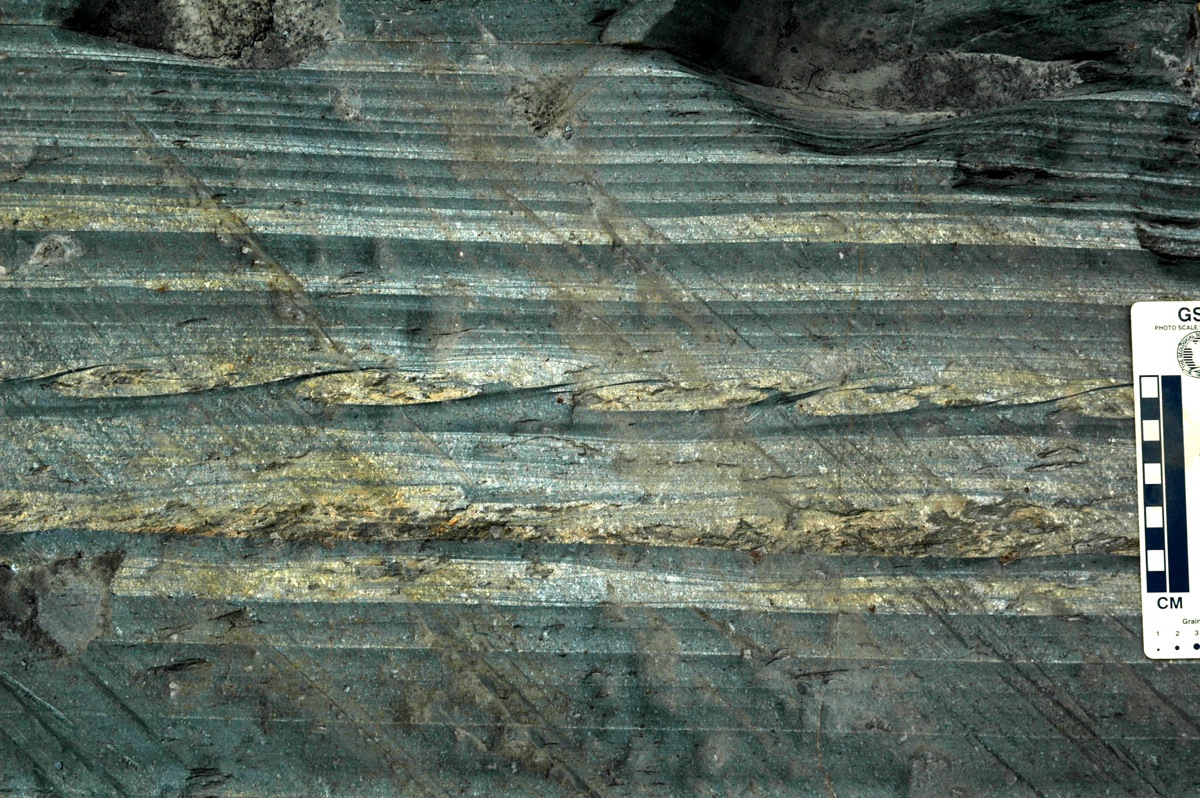
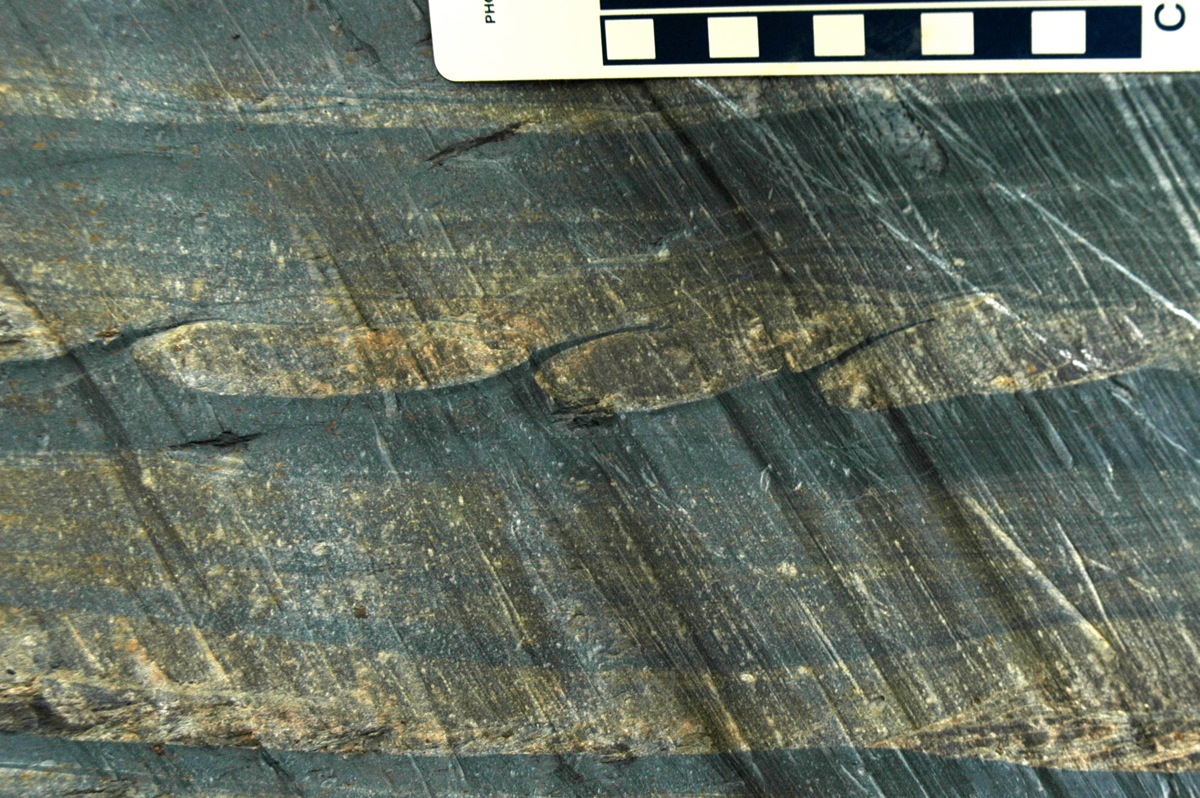
What is even more interesting is the fact that these plumes terminate relatively abruptly and it is very likely that they form density underflows in the lake. In other words, the sediment-rich water descends toward the lake bottom and flows down the slope as an underwater extension of the river, until it reaches the deepest parts of the lake. That is where it slows down and lets all of the sediment settle out, probably forming a graded layer, similar to the graded turbidites well known from marine sediments and rocks.

Such underflows often form in lakes when the sediment concentration in the river entering the lake is relatively high. In addition to the sediment concentration, the density excess can be enhanced by lower temperatures of the river. However, if the river is entering a sea or the ocean, it is much more difficult to form such underflows (that are often called hyperpycnal flows — just to make it a bit more confusing 🙂 ), because seawater has a lot of salt in it and therefore is denser than the river’s water. In this case, the sediment concentration of the river must be much higher to overcome the density of the seawater.

River, minibasin, delta, lake


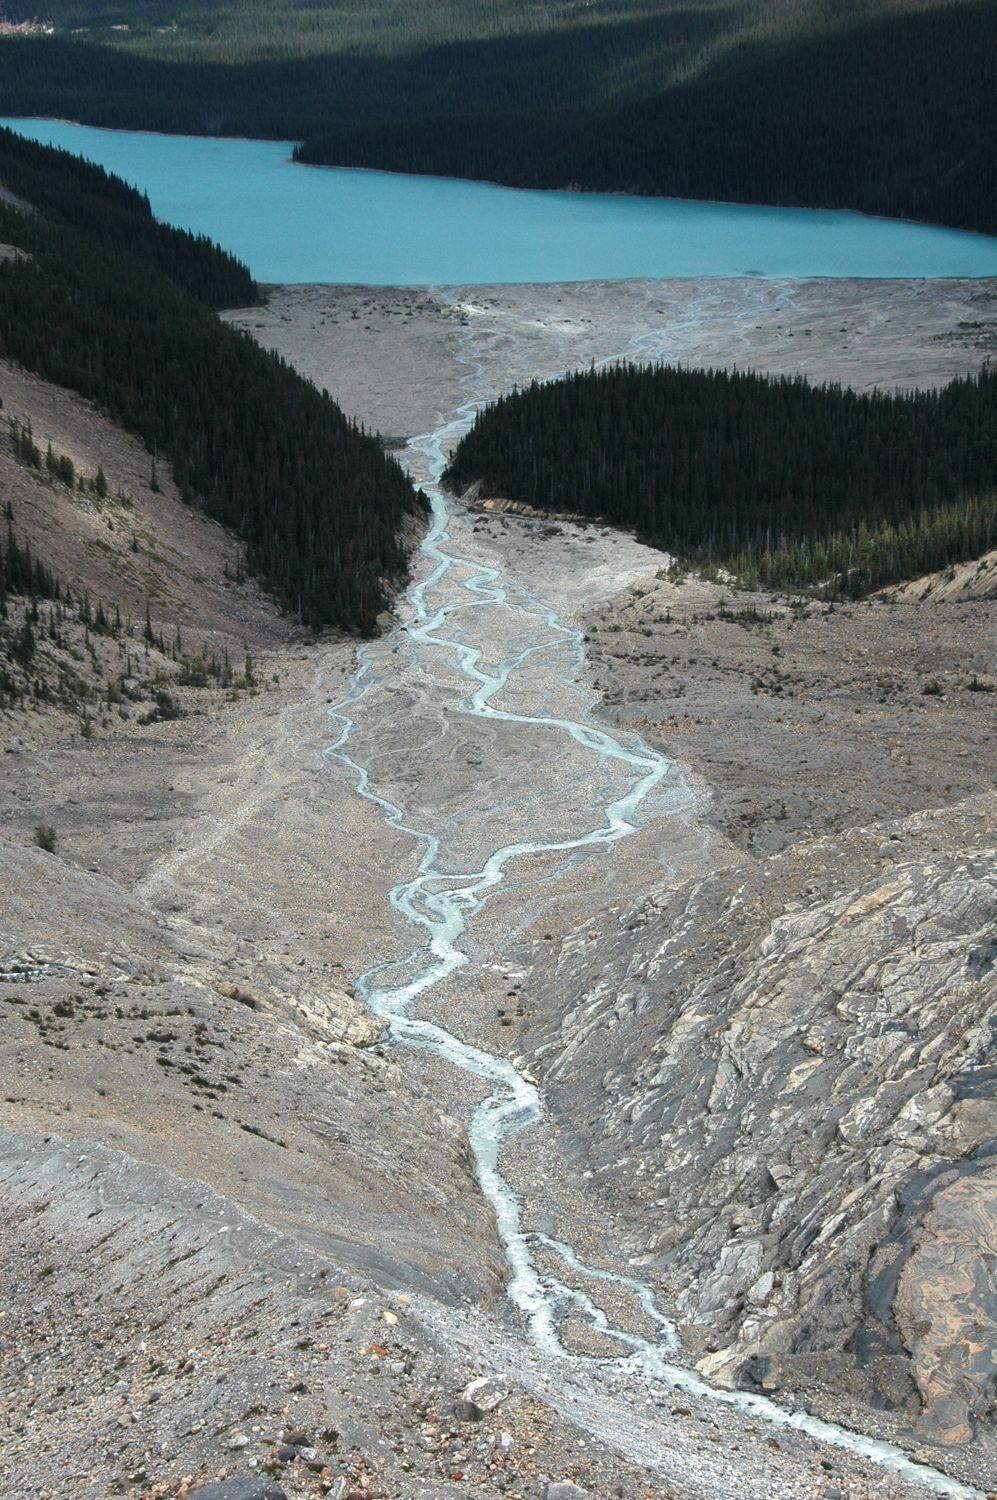
As you walk up from the lakeshore toward the apex of the delta (which, by the way, has a classic triangular textbook delta shape), the size of the clasts on the delta’s surface slowly increases (statistically speaking). Further up, the valley gets narrow and then widens up again, giving place to a small minibasin. This minibasin probably was a lake some time ago, a lake that was completely filled.

The river is a Serious River


Where the delta meets the lake, you can easily get close to the distributary channels and their termination points. The coarser sediment tends to be deposited here from the flow, because the flow expands as it enters the lake and its velocity drops. Lower velocity means (1) lower shear stress at the bottom, and therefore fewer grains carried along the bottom, and (2) lower turbulence in the water column, which translates to less sediment carried in suspension. The enhanced deposition right in front of the channel mouth gives rise to a so-called distributary mouth bar, that tends to split the flow into two branches. With time, the mouth bar becomes an island, and the channel splits into two lower-order and simultaneously active distributary channels.

One of the distributary channels, with a nice mouth bar that splits the flow into two

It turns out, of course, that I am not the first to note how superb this little sedimentary system is — there are a number of studies that looked at the density underflows of Peyto Lake. This article tells us that Peyto Lake has a 7 m high sill in the middle, which splits the lake into two subbasins. Underflows (or turbidity currents) fill with sediment-rich water the updip subbasin to the spillpoint, and then the underflow spills over into the other subbasin. As far as I know, this is the only documented example of a truly ponded turbidity current. It has also been calculated that 61% of the sediment deposited in the lake comes from the underflows (most of the rest of the deposition is due to delta progradation).

Detailed view of the sediment-rich distributary mouths and their plumes


The sad news is that, with sedimentation rates similar to those observed today, Peyto Lake will be completely filled within less than 600 years. You should go and witness this jawdropping place before that happens.

* * *

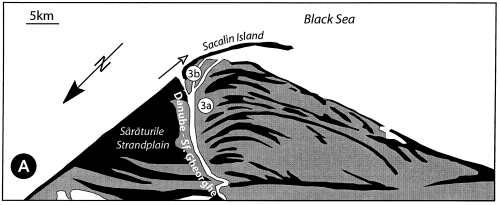
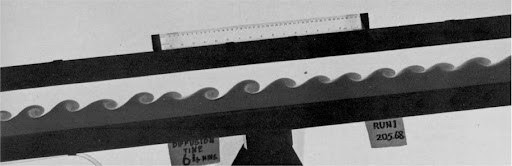
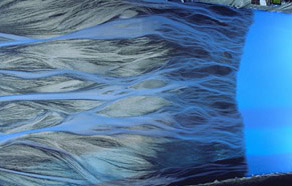
PS: As Brian points out, the Peyto delta is remarkably similar to some of the experimental deltas generated at St. Anthony Falls Laboratory. See for example the image above — it is *not* a lake in the Canadian Rockies!

A Tarkői Homokkő a Sedimentology borítóján

Az agusztusi Sedimentology borítóján látható fotó a Bodza völgyében készült, még akkoriban, amikor alulírott arrafele méricskélte a homokköveket. Mint sok zöldfülű doktorandusz, nem igazán tudtam akkor, hogy mire is lesz majd jó a sok rétegtani szelvény, de utólag találtam a válaszra kérdést, és most fordított sorrendben a kérdés és a válasz is benne vannak ugyanabban a Sedimentology számban.

Ha valakit esetleg érdekel — a cikk lényege az, hogy a bodza-völgyi rétegvastagságokat legjobban a lognormális eloszlással lehet jellemezni, annak ellenére, hogy egyesek szerint a hatványfüggvény-eloszlás (vagy fraktáleloszlás) a domináns a turbiditeknél. A fraktáleloszlás valóban izgalmas, de csak akkor, ha van rá jó bizonyíték — de sok esetben a bizonyíték hiányzik, és egy egyszerű log-log grafikon alapján egyesek hajlamosak fraktálnak nyílvánítani mindent.

A Tarkői Homokkő – és az olaszországi Marnoso-Arenacea Formáció – esetén világosan kimutatható, hogy a lognormális eloszlás jellemzi a vastagon és a vékonyan rétegzett turbiditeket egyaránt. És nem csak a statisztikai elemzés mutatja ezt, hanem valahogy filozofálgató szinten is szimpatikusabb nekem ez a “megoldás”, mint akár a fraktáleloszlás, akár az exponenciális eloszlás, még akkor is, ha ez utóbbiak izgalmas spekulálgatásokra adnak okot, skála-független fizikáról, Poisson folyamatokról, meg önszerveződő kritikalitásról (angol “self-organized criticality”).

Na, ez kezd nagyon posztmodernül hangzani, úgyhogy jobb, ha abbahagyom.